
Dubai’s real estate market recorded 37,292 sales transactions worth AED 92.63 billion in Q3 2026, according to the supplied market data. Residential property accounted for 97.8% of transactions, while off-plan properties represented 67.4% of total sales transactions. The residential market recorded a median transaction value of AED 1.10 million and a median price of AED 1,700 per sq ft.
The quarter also showed strong activity in the rental market, with 242,500 residential rental registrations, including 114,919 new registrations and 127,581 renewals. The median annual residential rent was AED 73,000.
Dubai Real Estate Market Q3 2026: Key Highlights
The third quarter produced a substantial volume of transactions across Dubai's residential, commercial and land markets.
|
Market indicator |
Q3 2026 |
|
Total sales transactions |
37,292 |
|
Total sales value |
AED 92.63B |
|
Median transaction value |
AED 1,214,327 |
|
Residential share |
97.8% |
|
Off-plan share |
67.4% |
|
Residential unit median PSF |
AED 1,700 |
The figures indicate that residential property remained the principal component of Dubai's sales market. At the same time, the relatively high value recorded in the ready market shows that transaction volume and transaction value were not distributed in the same proportion between off-plan and completed properties.
Dubai Property Sales Performance in Q3 2026
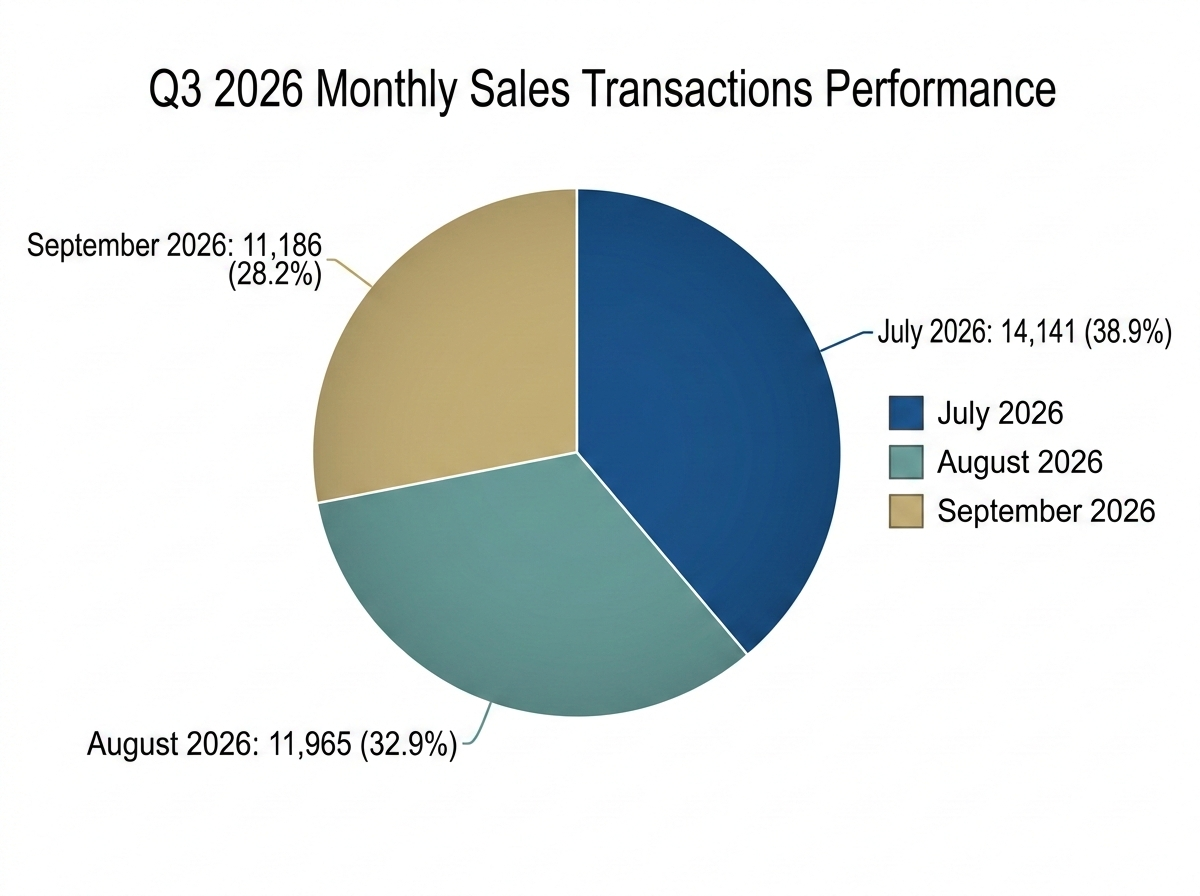
Dubai recorded 37,292 sales transactions during Q3 2026, generating AED 92.63 billion in sales value. Monthly activity varied during the quarter. July was the strongest month by transaction count, with 14,141 transactions. August recorded 11,965 transactions, while September recorded 11,186.
Monthly Sales Performance
|
Month |
Sales transactions |
Sales value |
|
July 2026 |
14,141 |
AED 34.92B |
|
August 2026 |
11,965 |
AED 28.54B |
|
September 2026 |
11,186 |
AED 29.16B |
|
Q3 2026 |
37,292 |
AED 92.63B |
July accounted for the largest monthly transaction count during the quarter. Transaction activity then moderated in August and September, although September's sales value increased from August despite a lower number of transactions.
Off-Plan vs Ready Property Market in Dubai
Off-plan property remained the larger segment by transaction volume in Q3 2026.
The market recorded 25,131 off-plan transactions, equivalent to 67.4% of total transactions. Ready properties accounted for 12,161 transactions, or 32.6%.
|
Market segment |
Transactions |
Share |
Sales value |
|
Off-plan |
25,131 |
67.4% |
AED 43.49B |
|
Ready |
12,161 |
32.6% |
AED 49.14B |
|
Total |
37,292 |
100% |
AED 92.63B |
The data presents an important distinction between transaction volume and sales value. Off-plan properties accounted for more than two-thirds of transactions, but ready properties generated a higher total sales value of AED 49.14 billion compared with AED 43.49 billion for off-plan properties.
This indicates that the ready-property segment had a higher average transaction value during the quarter, even though its transaction volume was considerably lower.
Dubai Residential Property Market Q3 2026
Residential property was the dominant segment of Dubai's real estate market during the quarter. There were 32,517 residential unit transactions, with a median transaction value of AED 1.10 million, a median price of AED 1,700 per sq ft, and a median unit area of 67.8 sq m.
|
Residential market indicator |
Q3 2026 |
|
Residential unit transactions |
32,517 |
|
Median transaction value |
AED 1,100,000 |
|
Median PSF |
AED 1,700 |
|
Median unit area |
67.8 m² |
The residential figures show a market concentrated around relatively compact units, with apartments accounting for the largest share of transactions.
Property Type Breakdown in Dubai Q3 2026
The property-type data provides a more detailed picture of what buyers and investors purchased during the quarter.
|
Property type |
Property sub-type |
Transactions |
Share |
Sales value |
|
Unit |
Flat |
30,139 |
80.8% |
AED 47.19B |
|
Building |
Villa |
2,211 |
5.9% |
AED 8.27B |
|
Land |
Residential |
1,233 |
3.3% |
AED 9.95B |
|
Unit |
Office |
1,127 |
3.0% |
AED 4.37B |
|
Land |
Commercial |
781 |
2.1% |
AED 12.29B |
|
Unit |
Hotel Apartment |
662 |
1.8% |
AED 1.07B |
|
Unit |
Shop |
358 |
1.0% |
AED 1.23B |
|
Unit |
Hotel Rooms |
228 |
0.6% |
AED 0.23B |
|
Land |
Land |
58 |
0.2% |
AED 1.11B |
|
Land |
General Use |
55 |
0.1% |
AED 1.20B |
|
Land |
Airport |
51 |
0.1% |
AED 0.52B |
|
Land |
Villa |
32 |
0.1% |
AED 0.35B |
|
Land |
Residential Flats |
29 |
0.1% |
AED 0.96B |
|
Land |
Industrial |
25 |
0.1% |
AED 0.71B |
|
Land |
Labor Camp |
18 |
0.0% |
AED 0.23B |
|
Land |
Residential / Attached Villas |
17 |
0.0% |
AED 0.04B |
|
Land |
Government Housing |
14 |
0.0% |
AED 0.15B |
|
Land |
Residential / Villas |
11 |
0.0% |
AED 0.14B |
|
Land |
Agricultural |
4 |
0.0% |
AED 0.05B |
|
Land |
Unit |
4 |
0.0% |
AED 0.13B |
The dominance of flats is particularly pronounced. 30,139 flat transactions represented 80.8% of the property-type transactions listed in the report, with a sales value of AED 47.19 billion. Villas followed with 2,211 transactions and a sales value of AED 8.27 billion.
This distribution highlights the depth of demand for apartment-led residential inventory in Dubai during Q3.
Residential vs Commercial Real Estate in Dubai
Residential transactions dominated the overall market. The data records 36,466 residential transactions, representing 97.8% of the market, with a sales value of AED 79.35 billion. Commercial transactions accounted for 826 transactions, or 2.2%, with a sales value of AED 13.27 billion.
|
Usage |
Transactions |
Share |
Sales value |
|
Residential |
36,466 |
97.8% |
AED 79.35B |
|
Commercial |
826 |
2.2% |
AED 13.27B |
|
Total |
37,292 |
100% |
AED 92.62B |
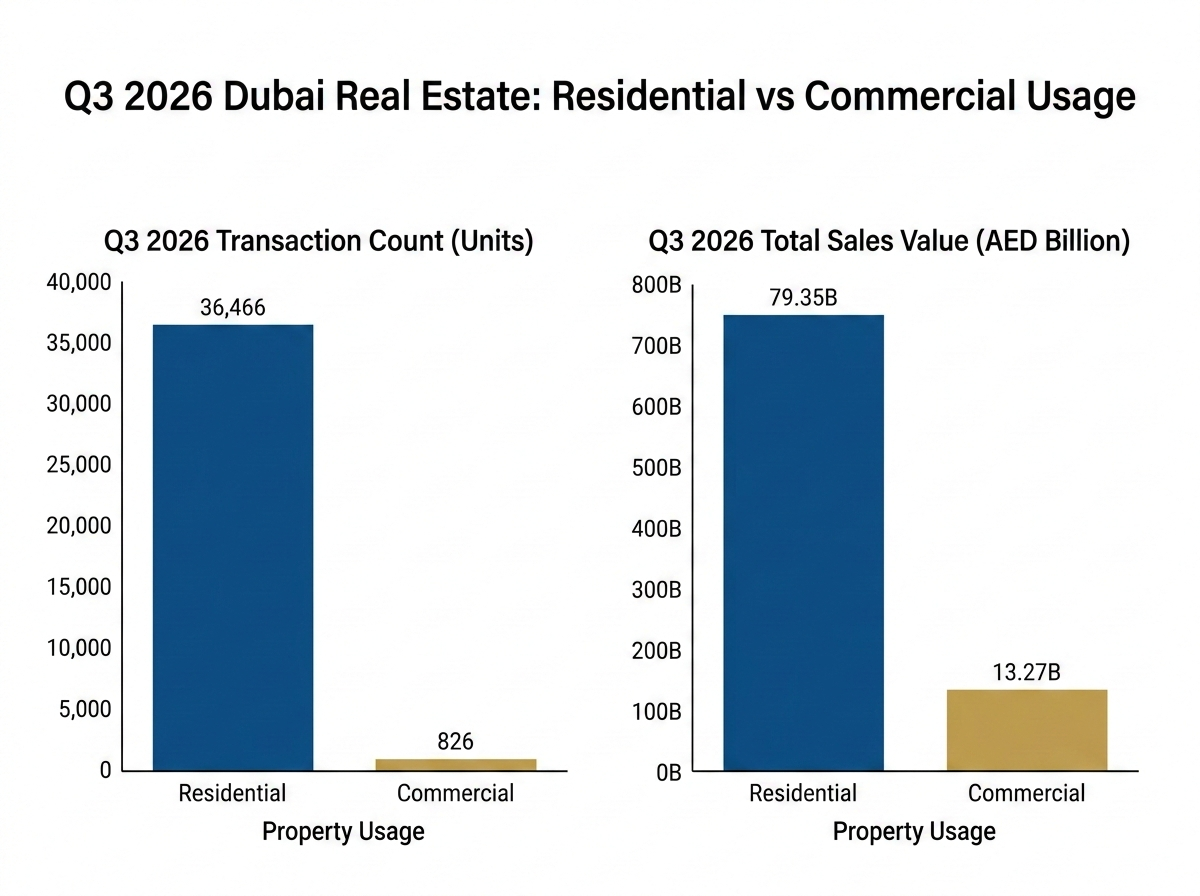
The transaction split demonstrates the scale of residential activity relative to commercial property. Commercial assets, however, generated a substantial sales value despite their smaller transaction count.
Freehold vs Non-Freehold Property Market
Ownership structure is another important indicator of Dubai's property market. Freehold properties accounted for 35,852 transactions, representing 96.1% of total transactions and AED 87.06 billion in sales value. Non-freehold properties recorded 1,440 transactions, equivalent to 3.9%, with a sales value of AED 5.56 billion.
|
Ownership type |
Transactions |
Share |
Sales value |
|
Freehold |
35,852 |
96.1% |
AED 87.06B |
|
Non-freehold |
1,440 |
3.9% |
AED 5.56B |
|
Total |
37,292 |
100% |
AED 92.62B |
Residential Ownership Structure
The residential ownership breakdown provides further detail.
|
Ownership |
Property type |
Transactions |
Sales value |
|
Freehold |
Unit |
31,750 |
AED 53.37B |
|
Freehold |
Building |
1,899 |
AED 8.43B |
|
Freehold |
Land |
1,513 |
AED 14.53B |
|
Non-freehold |
Unit |
767 |
AED 0.71B |
|
Non-freehold |
Building |
313 |
AED 0.57B |
|
Non-freehold |
Land |
224 |
AED 1.73B |
The residential ownership figures show that freehold units represented the largest category, with 31,750 transactions and AED 53.37 billion in sales value.
What Property Sizes Are Buyers Choosing in Dubai?
Buyer preferences during Q3 2026 were strongly concentrated around studios and one-bedroom homes.
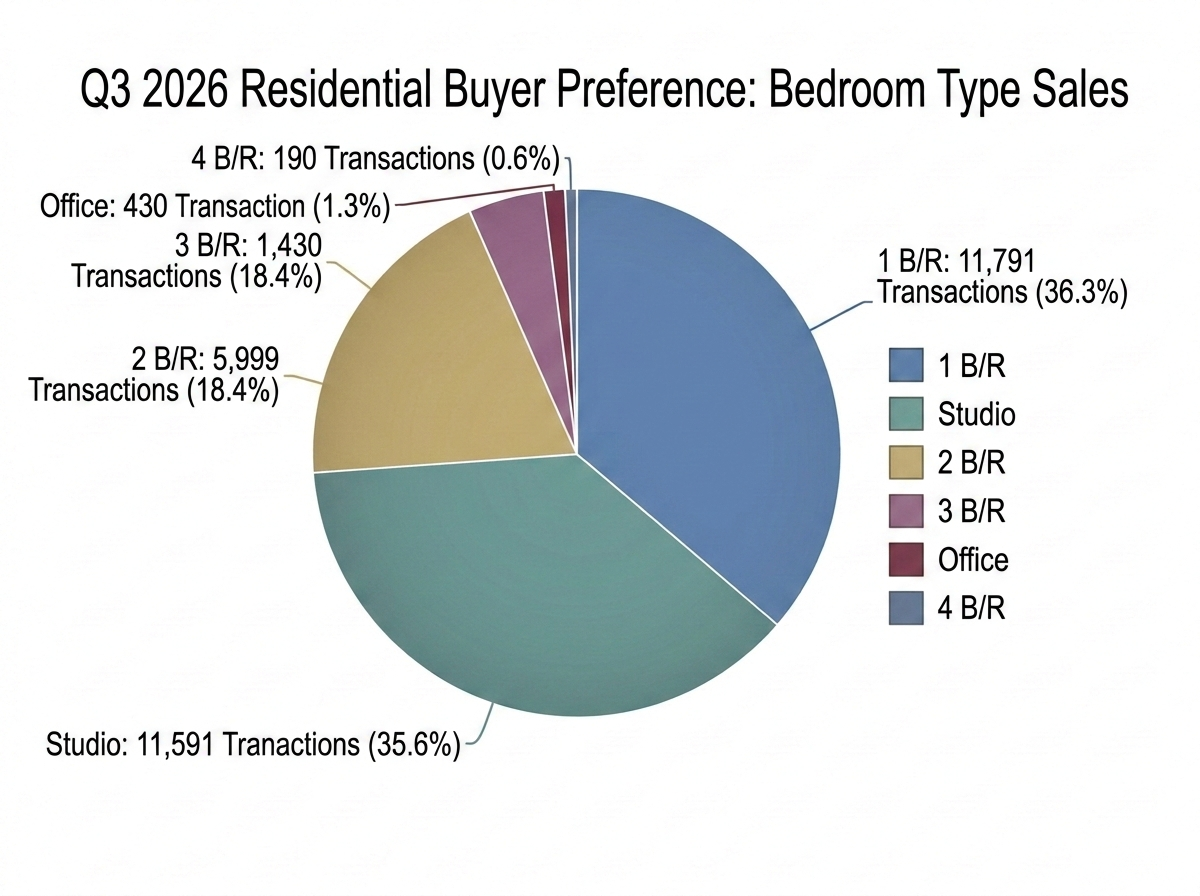
One-bedroom properties recorded 11,791 transactions, representing 36.3% of residential unit sales. Studios followed closely with 11,591 transactions, accounting for 35.6%. Two-bedroom units represented 18.4% of sales.
|
Bedroom type |
Transactions |
Share of residential unit sales |
|
1 B/R |
11,791 |
36.3% |
|
Studio |
11,591 |
35.6% |
|
2 B/R |
5,999 |
18.4% |
|
3 B/R |
1,430 |
4.4% |
|
Office |
430 |
1.3% |
|
4 B/R |
190 |
0.6% |
Studios and one-bedroom properties together accounted for more than seven out of every ten transactions recorded in this buyer-preference dataset. Larger three- and four-bedroom properties represented a much smaller share.
Dubai's Most Active Areas by Sales Transactions
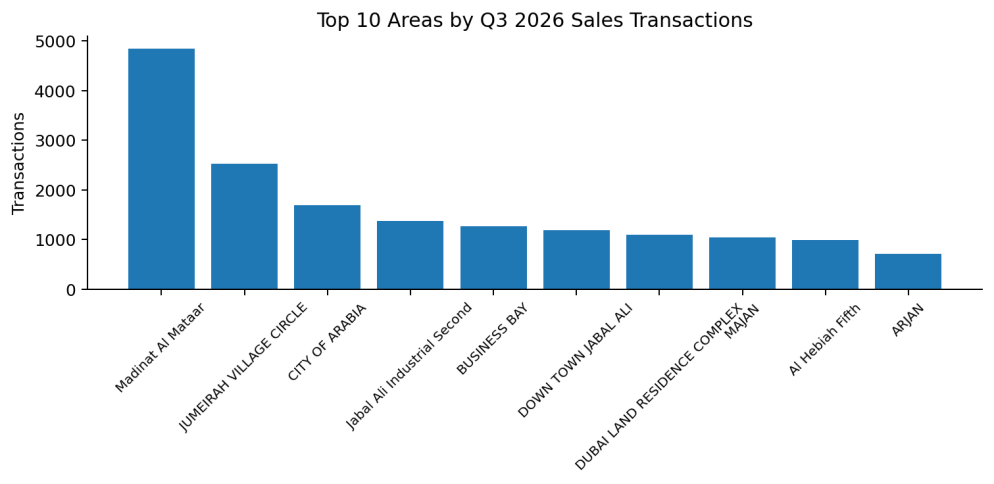
Activity was concentrated in a number of established and emerging districts. Madinat Al Mataar led the quarter with 4,849 transactions and AED 6.18 billion in sales value. Jumeirah Village Circle followed with 2,532 transactions and AED 3.57 billion. The City of Arabia recorded 1,688 transactions and AED 3.66 billion.
|
Area |
Transactions |
Sales value |
|
Madinat Al Mataar |
4,849 |
AED 6.18B |
|
JUMEIRAH VILLAGE CIRCLE |
2,532 |
AED 3.57B |
|
CITY OF ARABIA |
1,688 |
AED 3.66B |
|
Jabal Ali Industrial Second |
1,373 |
AED 1.53B |
|
BUSINESS BAY |
1,266 |
AED 4.40B |
|
1,191 |
AED 1.38B |
|
|
1,092 |
AED 1.32B |
|
|
1,047 |
AED 1.06B |
|
|
Al Hebiah Fifth |
987 |
AED 1.96B |
|
719 |
AED 0.93B |
The ranking shows a mix of residential communities, business districts and industrial areas. Madinat Al Mataar stands out by a significant margin in transaction volume.
Dubai Areas Ranked by Sales Value
Transaction volume does not always correspond directly with total sales value. For example, Business Bay recorded 1,266 transactions but generated AED 4.40 billion, placing it second by sales value despite ranking fifth by transaction volume. Palm Jumeirah recorded only 222 transactions but generated AED 3.25 billion.
|
Area |
Transactions |
Sales value |
|
Madinat Al Mataar |
4,849 |
AED 6.18B |
|
BUSINESS BAY |
1,266 |
AED 4.40B |
|
CITY OF ARABIA |
1,688 |
AED 3.66B |
|
JUMEIRAH VILLAGE CIRCLE |
2,532 |
AED 3.57B |
|
PALM JUMEIRAH |
222 |
AED 3.25B |
|
BURJ KHALIFA |
531 |
AED 3.04B |
|
Al Yufrah 1 |
678 |
AED 2.81B |
|
Al Hebiah Fifth |
987 |
AED 1.96B |
|
224 |
AED 1.72B |
|
|
Jabal Ali First |
705 |
AED 1.64B |
The difference between transaction ranking and sales-value ranking is particularly relevant when evaluating market activity. Premium locations can produce high sales values from comparatively fewer transactions because of their higher individual transaction values.
Dubai Rental Market Q3 2026
The rental market remained active during the quarter, with 242,500 residential rental registrations. Of these, 114,919 were new registrations, while 127,581 were renewals. The median annual residential rent was AED 73,000.
|
Rental market indicator |
Q3 2026 |
|
Residential rental registrations |
242,500 |
|
New registrations |
114,919 |
|
Renewals |
127,581 |
|
Median annual rent |
AED 73,000 |
Renewals accounted for the larger portion of registrations, indicating continued tenant retention alongside new rental activity.
Monthly Rental Registrations in Dubai
Rental activity increased through the quarter. July recorded 78,109 residential rental registrations. August increased slightly to 79,014, while September reached 85,377, the highest monthly level in the supplied Q3 dataset.
|
Month |
Residential registrations |
|
July 2026 |
78,109 |
|
August 2026 |
79,014 |
|
September 2026 |
85,377 |
|
Q3 total |
242,500 |
Unlike sales transactions, which declined month by month during Q3, rental registrations increased during each successive month. September therefore represented the strongest month for rental registration activity within the quarter.
Dubai Rental Activity by Area
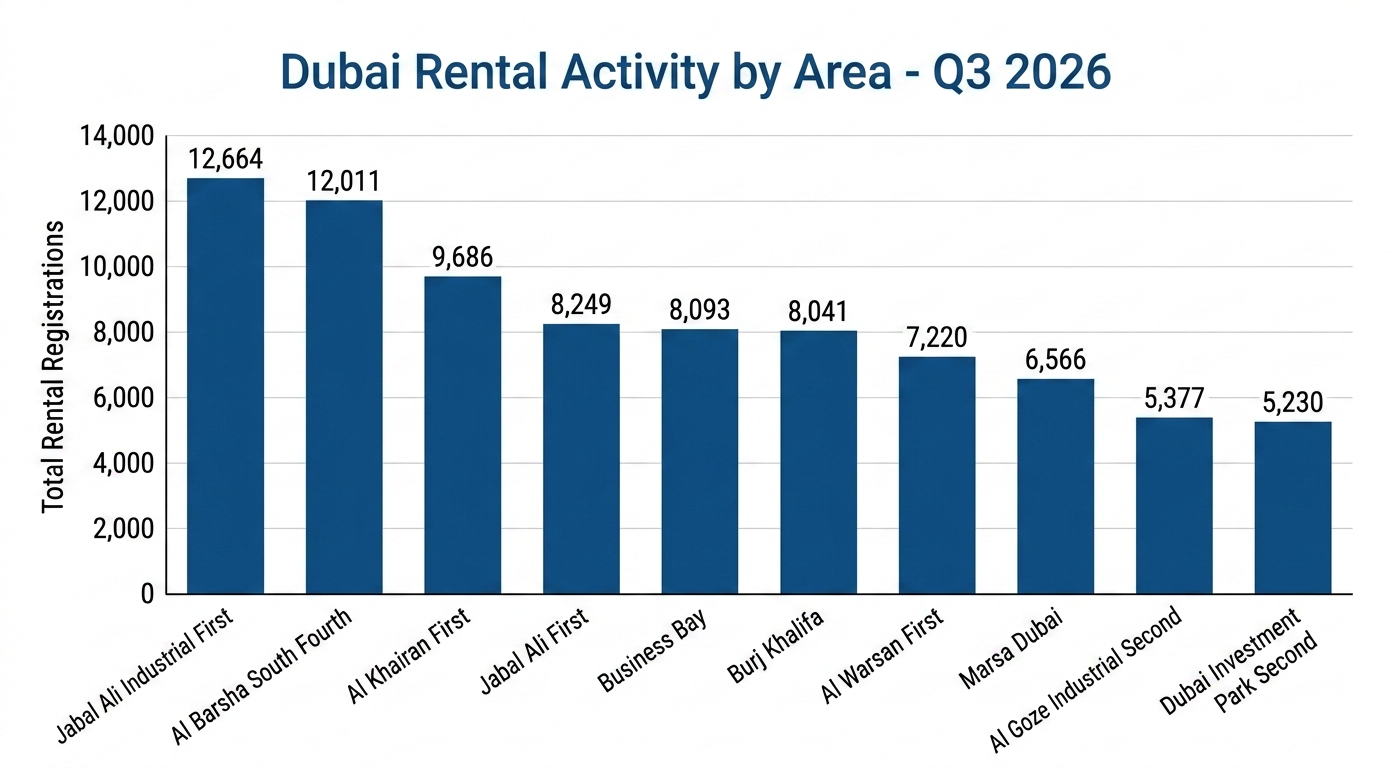
Rental registrations were distributed across a broad range of locations, with significant activity recorded in industrial, residential and central business districts.
Jabal Ali Industrial First recorded the highest number of registrations in the supplied ranking at 12,664, followed by Al Barsha South Fourth with 12,011 and Al Khairan First with 9,686.
|
Area |
Registrations |
Median annual rent |
|
Jabal Ali Industrial First |
12,664 |
AED 1,557,000 |
|
Al Barsha South Fourth |
12,011 |
AED 64,000 |
|
Al Khairan First |
9,686 |
AED 110,000 |
|
Jabal Ali First |
8,249 |
AED 67,000 |
|
Business Bay |
8,093 |
AED 86,035 |
|
Burj Khalifa |
8,041 |
AED 160,000 |
|
Al Warsan First |
7,220 |
AED 38,901 |
|
6,566 |
AED 115,000 |
|
|
Al Goze Industrial Second |
5,377 |
AED 150,600 |
|
5,230 |
AED 486,000 |
|
|
Al Barshaa South Third |
5,138 |
AED 60,000 |
|
Nadd Hessa |
4,939 |
AED 56,000 |
|
Me'Aisem First |
4,921 |
AED 65,000 |
|
Al Hebiah Fifth |
4,556 |
AED 85,000 |
|
4,527 |
AED 78,000 |
Project-Level Real Estate Activity in Dubai
Project-level transactions provide another view of demand, particularly within large-scale developments.
The Dubai real estate Q3 data records several projects with more than 300 transactions during Q3 2026. Azizi Venice projects occupy several positions in the ranking, while RAW District by Imtiaz, Binghatti Skyterraces, DAMAC Lagoons - Valencia, Valia and Eltiera Views also recorded substantial activity.
|
Project |
Transactions |
Sales value |
|
Azizi Venice 6 |
674 |
AED 587.1M |
|
AZIZI VENICE 14 |
628 |
AED 452.5M |
|
RAW DISTRICT BY IMTIAZ R |
605 |
AED 626.2M |
|
RAW DISTRICT BY IMTIAZ CR |
521 |
AED 688.0M |
|
Azizi Venice 15 |
512 |
AED 440.0M |
|
434 |
AED 297.7M |
|
|
AZIZI VENICE 7 |
403 |
AED 308.3M |
|
Binghatti Skyterraces |
403 |
AED 396.9M |
|
azizi venice 13 |
397 |
AED 306.7M |
|
DAMAC LAGOONS - VALENCIA |
358 |
AED 428.1M |
|
Valia |
322 |
AED 897.8M |
|
ELTIERA VIEWS |
320 |
AED 815.8M |
|
azizi venice 12 |
320 |
AED 295.7M |
|
310 |
AED 564.9M |
|
|
298 |
AED 339.8M |
Transaction count is not necessarily an indicator of the highest sales value. Valia recorded 322 transactions but generated AED 897.8 million, while Eltiera Views recorded 320 transactions and AED 815.8 million. Both therefore produced higher sales values than several projects with substantially more transactions.
What the Q3 2026 Dubai Real Estate Data Shows
The Q3 figures point to several clear characteristics of Dubai's property market.
1. Residential property remains the core market
Residential transactions represented 97.8% of the overall market. The scale of residential activity was substantially higher than commercial activity, both in transaction count and sales value.
2. Off-plan remains the larger transaction segment
Off-plan properties accounted for 67.4% of transactions. This means approximately two out of every three sales transactions in the supplied dataset were off-plan.
However, ready properties generated a higher total sales value. This distinction is important when assessing market performance because transaction volume and capital value tell different parts of the story.
3. Apartments dominate property transactions
Flats accounted for 30,139 transactions and 80.8% of the property-type breakdown. Villas represented 5.9%. The dominance of apartments is also reflected in buyer preferences, where studios and one-bedroom properties together represented the largest concentration of residential unit transactions.
4. Freehold properties dominate ownership
Freehold transactions represented 96.1% of the overall market. Non-freehold transactions accounted for 3.9%.
5. Rental activity moved higher through the quarter
Sales transaction volumes declined from July to September, whereas residential rental registrations increased from 78,109 to 85,377.
This creates an important distinction between the sales and rental markets during the quarter.
Sales Market vs Rental Market: Q3 2026
|
Indicator |
July 2026 |
August 2026 |
September 2026 |
|
Sales transactions |
14,141 |
11,965 |
11,186 |
|
Sales value |
AED 34.92B |
AED 28.54B |
AED 29.16B |
|
Rental registrations |
78,109 |
79,014 |
85,377 |
The combined monthly view highlights two different market patterns. Sales transaction volume was highest in July and declined through the quarter, while rental registrations rose steadily.
September's sales value was also higher than August despite fewer transactions, showing that the value of individual transactions can materially affect monthly market performance.
Dubai Real Estate Market Outlook for Q4 2026
The Q3 2026 data presents a market with strong residential participation, substantial off-plan activity and a highly dominant freehold segment.
The sales market was led by residential transactions, with flats accounting for the largest property category and one-bedroom and studio units attracting the greatest buyer activity. At the same time, ready properties generated more sales value than off-plan properties despite recording fewer transactions.
The geographic distribution also demonstrates the different characteristics of Dubai's property districts. Madinat Al Mataar led transaction volume, while Business Bay, Palm Jumeirah and Burj Khalifa generated high sales values relative to their transaction counts.
The rental market followed a different trajectory. Quarterly rental registrations reached 242,500, and monthly registrations rose from 78,109 in July to 85,377 in September.
Taken together, the Q3 figures show that Dubai's real estate market continued to operate across multiple demand segments rather than following a single pattern. Off-plan transactions led volume, ready properties led sales value, apartments led residential demand, freehold properties dominated ownership and rental registrations strengthened towards the end of the quarter.
Conclusion
Dubai's Q3 2026 real estate market recorded 37,292 sales transactions worth AED 92.63 billion, confirming the scale of activity across residential, commercial and land segments. Residential property remained the clear market leader, accounting for 97.8% of transactions, while off-plan properties represented 67.4% of transaction volume.
The quarter also showed a strong preference for apartments, studios and one-bedroom homes. Freehold property dominated ownership, while areas such as Madinat Al Mataar, Jumeirah Village Circle, City of Arabia and Business Bay recorded significant transaction activity.
The rental market presented a separate pattern, with registrations rising each month and reaching 85,377 in September. With 242,500 residential rental registrations recorded during the quarter, rental activity remained an important part of Dubai's overall property market.
Overall, the Q3 2026 data points to a market where transaction volume, sales value, property type, ownership structure and rental activity are moving at different rates. For investors, developers, brokers and end users, these distinctions provide a more useful picture of market conditions than headline transaction numbers alone.