
Dubai registered 15,258 property transactions worth AED 41.35 billion in August 2026, based on Dubai Land Department records for the month. Direct sales accounted for 11,243 of those transactions at AED 26.71 billion. Mortgage registrations added 3,438 filings worth AED 11.45 billion, and 577 gift transfers accounted for the remaining AED 3.18 billion. The median sale price came in at AED 1.22 million against an average of AED 2.38 million.
August 2026 Dubai Real Estate Market Overview
|
Metric |
Figure |
|
Total transactions |
15,258 |
|
Total value |
AED 41.35 billion |
|
Sales |
11,243 · AED 26.71 billion |
|
Mortgages |
3,438 · AED 11.45 billion |
|
Gifts |
577 · AED 3.18 billion |
|
Median sale price |
AED 1.22 million |
|
Average sale price |
AED 2.38 million |
|
Off-plan share of sales |
67.7% by volume, 50.2% by value |
|
Top area by value |
Madinat Al Mataar (AED 2.46 billion) |
All figures: DLD, 1–31 August 2026.
Types of Property Transactions in Dubai
The Land Department breaks down recorded capital across three primary registration groups. Direct sales contracts led both transaction volume and total capital. Mortgage took second place, while official gift transfers added substantial value despite minimal transaction counts.
|
Transaction type |
Transactions |
Value |
|
Sales |
11,243 |
AED 26.71bn |
|
Mortgages |
3,438 |
AED 11.45bn |
|
Gifts |
577 |
AED 3.18bn |
|
Total |
15,258 |
AED 41.35bn |
Off-Plan vs. Ready Property Sales in Dubai
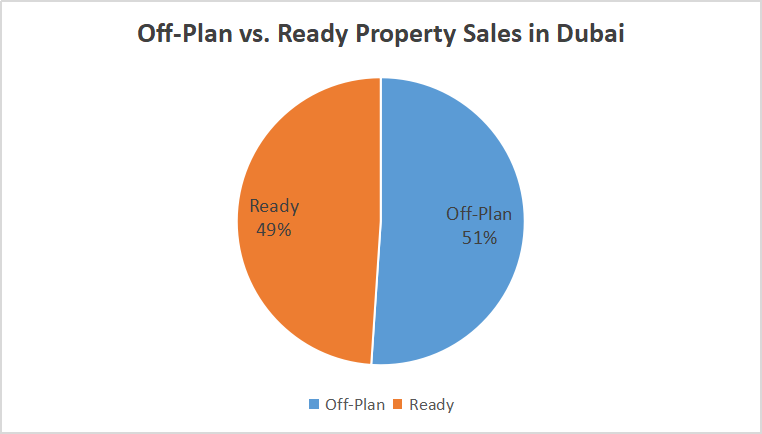
The split between off-plan developments sold through Oqood registrations and ready properties with complete Title Deeds tells two different stories depending on whether you track transaction volume or total capital. Off-plan transactions commanded 67.7% of all purchase contracts closed throughout the month. Yet when calculated by dirham volume, the two sides came out dead even: off-plan accounted for 50.2% of total sales capital at AED 13.42 billion, while ready properties accounted for 49.8% at AED 13.30 billion.
|
Segment |
Transactions |
Value |
Median Price |
|
Off-plan |
7790 (68%) |
AED 14.23 billion |
AED 1.11 m |
|
Ready |
7468 (48.9%) |
AED 27.12 billion |
AED 1.68 m |
The driver here comes down to floor plans and unit prices per square foot. Off-plan homes commanded a median price of AED 1.11 m, 51% higher than existing ready-to-move properties, which traded at AED 1.68 m. At the same time, off-plan units averaged just 63 square meters, leaving them 22% smaller than completed resale properties, where the median unit measured 81 square meters.
Top Performing Dubai Neighborhoods by Sales Value and Volume
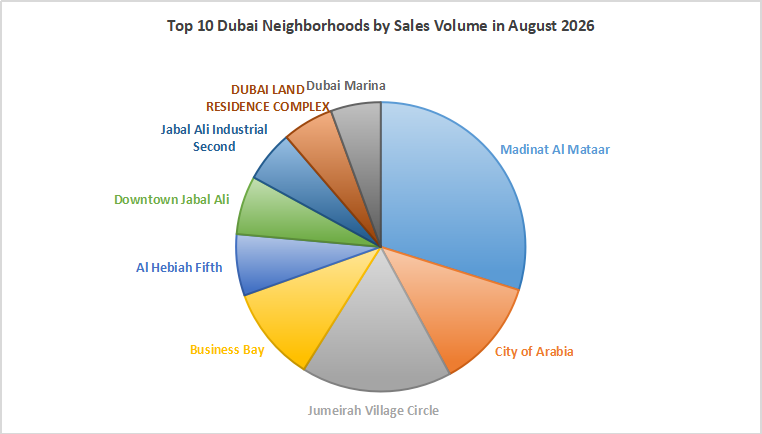
August transaction maps show a distinct divide across the emirate. Substantial off-plan absorption pushed deep into outer development zones, whereas older luxury waterfront communities secured major capital on far smaller transaction numbers.
|
Area |
Sales |
Value (AED bn) |
Off-plan share |
|
Madinat Al Mataar |
1,875 |
2.56 billion |
97.7% |
|
771 |
0.884 billion |
97.6% |
|
|
1058 |
1.35 billion |
34.4% |
|
|
669 |
2.11 billion |
24.3% |
|
|
Al Hebiah Fifth |
431 |
0.90 billion |
40.6% |
|
412 |
0.51 billion |
94.4% |
|
|
Jebel Ali Industrial Second |
361 |
0.35 billion |
100% |
|
359 |
0.86 billion |
40% |
|
|
351 |
1.29 billion |
3.4% |
Madinat Al Mataar absorbed 1,875 sales worth AED 2.56 billion, taking first place across both volume and total dirham value. It operated almost entirely as an off-plan development corridor, with off-plan transactions making up 97% of its activity, an entry median price of AED 739,000, and a compact median layout of 35 square meters. By itself, Madinat Al Mataar constituted 12.3% of the total transaction volume recorded across Dubai during August.
Three other suburban expansion districts posted matching patterns: City of Arabia (97.6% off-plan), Downtown Jebel Ali (94.4% off-plan), and Jebel Ali Industrial Second (100% off-plan). Grouped together, these four peripheral corridors generated roughly a third of all sales in the city.
Established districts near the urban core showed steady, two-way market balance. Jumeirah Village Circle registered 771 transactions worth AED 1.35 billion, split evenly between off-plan and ready homes, with a median sales price of AED 1,000,000. Business Bay recorded 669 sales totaling AED 2.11 billion, with existing secondary properties making up 75.6% of district transaction volume at a median price point of AED 1.65 million. Both areas draw a balanced mix of tenant occupiers and private landlords, giving a clear picture of real-world rental yields and end-user demand.
Prime capital remained heavily focused on traditional high-end locations. Burj Khalifa recorded AED 2.36 billion in sales from just 293 registrations. Palm Jumeirah logged AED 1.94 billion across only 174 closed deeds, reflecting persistent high-net-worth demand for coastal real estate.
Dubai Property Price Per Square Foot: Ranking the Top Neighborhoods
Calculating values by square foot exposes the spread between luxury waterfront enclaves and affordable suburban communities. Among master-planned areas closing more than 100 unit sales during the month, off-plan island developments set the pace.
|
Area |
AED/sqft |
Median size (sqm) |
|
Palm Jebel Ali |
3,543 |
113 |
|
Al Khairan First |
2,632 |
116 |
|
Burj Khalifa |
2,564 |
114 |
|
Palm Deira |
2,376 |
101 |
|
Business Bay |
2,063 |
81 |
|
Dubai Marina |
2,061 |
90 |
|
Madinat Al Mataar |
1,759 |
35 |
|
Jumeirah Village Circle (JVC) |
1,413 |
71 |
|
Dubai Production City |
1,332 |
59 |
|
International City Phase 1 |
679 |
67 |
Palm Jebel Ali led the citywide ranking at AED 3,543 per square foot on homes averaging 113 square meters, trading above established towers in Burj Khalifa (AED 2,564 per square foot). Whether buyers can cash in on those price premiums once secondary resales begin will be an important trend to monitor.
Looking strictly at ready homes, prices followed familiar patterns. Existing apartments in Burj Khalifa averaged AED 2,441 per square foot, Palm Jumeirah posted AED 2,286, Dubai Creek Harbour cleared AED 2,228, Dubai Hills reached AED 2,097, Dubai Marina registered AED 1,996, Business Bay logged AED 1,759, JVC closed at AED 1,209, and International City stood at AED 658. Across the ready market, the price gap from top-tier luxury to entry-level suburbs sits at roughly 3.7 times.
Proximity to Dubai Metro stations provided no price lift in the August figures. Properties near metro stops averaged AED 1,643 per square foot, compared to AED 1,724 per square foot for units away from train lines. Older, lower-cost buildings make up most of Dubai's transit-linked housing inventory, which pulls down the overall square-foot average.
Dubai Real Estate Sales Trends by Unit Size
Floor plan choices skewed heavily toward small, entry-level apartments. Studios and one-bedroom units together accounted for 4565 sales, making up 29.9% of all residential home contracts signed during the month.
|
Unit Type |
Transaction Count |
Share (%) |
Sales Value |
Sub-type Breakdown |
|
Lands |
1,583 |
10.4% |
AED 15.04B |
Land (1,582), Building (1) |
|
1 BR |
4,565 |
29.9% |
AED 5.64B |
Flat (4,468), Hotel Apt (81), Hotel Room (11), Villa (5) |
|
Studio |
3,906 |
25.6% |
AED 2.60B |
Flat (3,690), Hotel Apt (150), Hotel Room (66) |
|
2 BR |
2,750 |
18.0% |
AED 6.11B |
Flat (2,648), Villa (64), Hotel Apt (37), Townhouse (1) |
|
3 BR |
1,223 |
8.0% |
AED 4.65B |
Flat (730), Villa (478), Hotel Apt (15) |
|
4 BR |
556 |
3.6% |
AED 2.95B |
Villa (471), Flat (80), Hotel Apt (5) |
|
Commercial |
303 |
2.0% |
AED 2.43B |
Office (205), Shop (96), Building (2) |
|
Office |
220 |
1.4% |
AED 0.55B |
- |
|
5 BR |
108 |
0.7% |
AED 0.90B |
Villa (100), Flat (7), Hotel Apt (1) |
|
Shop |
26 |
0.2% |
AED 0.08B |
- |
|
6 BR |
9 |
<0.1% |
AED 0.36B |
Flat (5), Villa (4) |
|
Penthouse |
9 |
<0.1% |
AED 0.03B |
- |
The median apartment footprint in Dubai measured 68 square meters, closing at a median price of AED 1.10 million. Villas and townhouses accounted for 609 sales, with a median size of 214 square meters and a median ticket price of AED 3.75 million. Villas and townhouses represented only 6% of total unit volume, yet accounted for 10% of all sales capital.
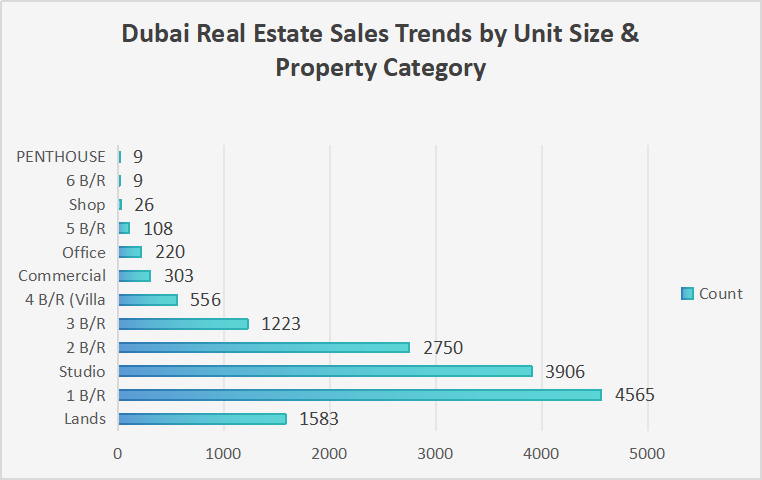
The price differential between three-bedroom units (AED 3.62 million median) and four-bedroom properties (AED 13.04 million median) reveals a steep barrier. Properties priced up to three bedrooms attract local families, mid-income professionals, and yield-focused investors. Beyond that point, the market shifts directly into high-end luxury, leaving limited options for mid-market buyers who need larger living spaces.
Residential vs. Commercial Property Trends in Dubai
Breaking down the figures by property category confirms that residential property carried the month. Built apartments and offices accounted for the overwhelming majority of registrations, while land and whole buildings accounted for large sums of capital across a small pool of transactions.
|
USAGE |
Count |
Percent |
|
Residential |
14768 |
96.8% |
|
Commercial |
490 |
3.2% |
Of all recorded transactions, 14,768 were residential against 490 commercial, demonstrating that Dubai's transaction volume continues to be led by homes rather than commercial assets. Commercial activity focused mainly on office floors in Business Bay, industrial plots in Jebel Ali, and selected warehouse zones.
For a property type-wise breakdown, then the numbers become like this
|
PROP TYPE |
Count |
Percent |
Transaction Value |
|
Unit |
12551 |
82.3% |
AED 21.06 billion |
|
Land |
1582 |
10.4% |
AED 14.69 billion |
|
Building |
1125 |
7.4% |
AED 5.6 billion |
Dubai Real Estate Sales Trends As Per Price Segment
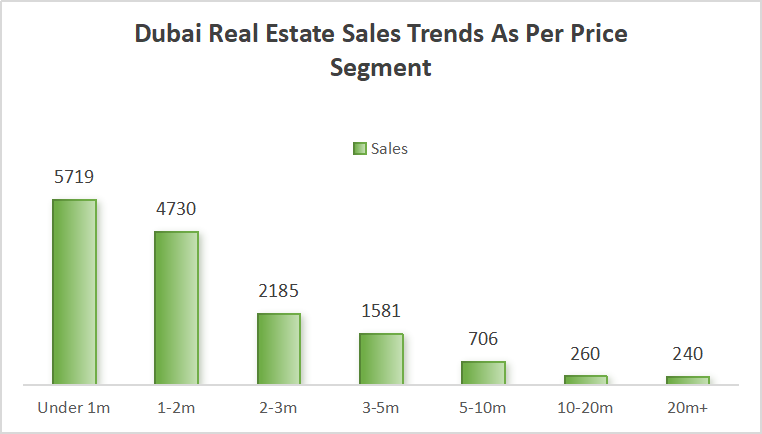
Tracking buyer spending across price tiers reveals how heavily wealth concentrates at the top end of Dubai's real estate market. While low-to-mid pricing drives day-to-day transaction count, prime luxury assets swallow a substantial share of total investment capital.
|
Price Band |
Sales |
% of transactions |
Value (AED bn) |
% of value |
|
Under 1m |
5719 |
37.09% |
3.79 |
9.06% |
|
1-2m |
4730 |
30.67% |
6.59 |
15.76% |
|
2-3m |
2185 |
14.17% |
5.3 |
12.68% |
|
3-5m |
1581 |
10.25% |
6.01 |
14.37% |
|
5-10m |
706 |
4.58% |
4.74 |
11.34% |
|
10-20m |
260 |
1.69% |
3.59 |
8.59% |
|
20m+ |
240 |
1.56% |
11.79 |
28.20% |
Transactions below AED 2 million made up 70.5% of all closed transactions, generating AED 7.78 billion or 29.1% of sales value. At the upper extreme, 240 transactions priced above AED 20 million accounted for less than 2% of total transactions, yet pulled in AED 11.79 billion, nearly a full fifth of all sales capital spent in August. These high-ticket purchases landed almost exclusively in four neighborhoods: Burj Khalifa, Business Bay, Palm Jumeirah, and Emirates Living.
Leading Real Estate Projects in Dubai by Sales Value
Because off-plan launches make up such a large share of the market, month-to-month swings in Dubai's overall transaction numbers are closely tied to individual developer launch schedules.
|
Project |
Sales |
Value |
Median price |
Median size |
Rate (psf) |
Dominant type |
Area |
|
Azizi Venice (15) |
421 |
AED 353.7m |
708,540 |
35 sq m |
1,731 |
Studio |
Madinat Al Mataar |
|
Azizi Milan 30 |
259 |
AED 175.1m |
589,000 |
33 sq m |
1,668 |
Studio |
City of Arabia |
|
Azizi Venice 6 |
220 |
AED 181.1m |
740,000 |
33 sq m |
2,042 |
Studio |
Madinat Al Mataar |
|
191 |
AED 190.2m |
747,898 |
38 sq m |
1,753 |
Studio |
Jebel Ali Industrial Second |
|
|
Raw District by Imtiaz CR |
189 |
AED 243.3m |
780,733 |
47 sq m |
1,794 |
Studio |
Down Town Jebel Ali |
|
186 |
AED 123.6m |
608,000 |
32 sq m |
1,764 |
Studio |
City of Arabia |
|
|
Azizi Venice 7 |
185 |
AED 141.1m |
692,998 |
33 sq m |
1,861 |
Studio |
Madinat Al Mataar |
|
181 |
AED 346.8m |
1,605,012 |
89 sq m |
1,580 |
1 B/R |
Madinat Al Mataar |
|
|
168 |
AED 260.0m |
1,284,500 |
69 sq m |
1,736 |
1 B/R |
City of Arabia |
|
|
Azizi Venice 10 |
134 |
AED 102.3m |
655,000 |
32 sq m |
1,709 |
Studio |
Madinat Al Mataar |
|
120 |
AED 80.1m |
550,500 |
32 sq m |
1,548 |
Studio |
Down Town Jebel Ali |
|
|
117 |
AED 603.7m |
4,354,000 |
113 sq m |
3,543 |
1 B/R |
Palm Jebel Ali |
|
|
116 |
AED 140.4m |
1,230,495 |
73 sq m |
1,628 |
1 B/R |
Al Hebiah Fifth |
|
|
Azizi Venice 11 |
111 |
AED 105.9m |
1,050,000 |
62 sq m |
1,684 |
1 B/R |
Madinat Al Mataar |
|
102 |
AED 119.0m |
1,042,046 |
50 sq m |
1,875 |
1 B/R |
Al Yufrah 1 |
Project-level sales reflected this gap. Azizi Venice 15 topped the deal count with 421 purchases worth AED 0.35 billion, whereas Emirates Hills reached AED 0.38 billion from just five luxury villa purchases.
When Do Most Real Estate Deals Close in Dubai?
Weekly transaction logs show that deal activity peaked mid-month, with higher-value transactions closing toward the month-end.
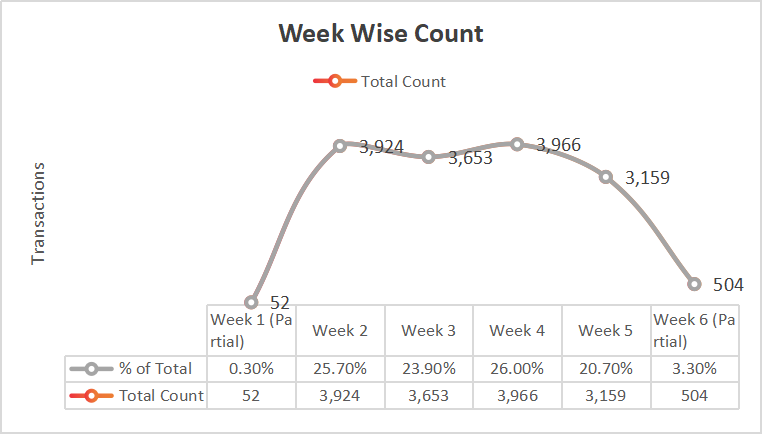
Transaction volume reached its highest points in Week 4 with 3,966 sales (26.0% of total) and Week 2 with 3,924 sales (25.7% of total), followed by Week 3 at 3,653 sales (23.9% of total). Week 5 saw volume moderate to 3,159 transactions (20.7% of total). The busiest single transaction days were August 17 (693 sales), August 18 (653 sales), and August 4 (640 sales).