Dubai property prices have completed a full market cycle over the last decade: steady growth (2014), correction (2015–2020), a record-breaking recovery (2021–2025) and, in 2026, a cooling phase. Average prices rose from 1,003 AED/sqft in 2014 to an all-time high of 1,863 AED/sqft in 2025 (+85.7%). In Q3 2026, Dubai recorded 37,292 sales worth AED 92.63 billion while prices eased only slightly from their February 2026 peak. Let's see a year-by-year analysis.
Want to know how Dubai's property market has changed since 2014? We hear it all the time. "Should I buy property in Dubai?" People ask us when they dream of owning a home or want to invest their money wisely.
Do you ever think why Dubai real estate is one of the best real estate markets in the world? And why do investors love it? Let's keep it simple and look at the facts that matter when you're thinking about buying.
When you crunch the numbers, you can see some areas have seen strong growth. Others have dropped. But handling too much raw data takes time. That's why we have analysed a 10-year property price trend. Waiting to know which is a good area to buy a property in Dubai?
Read on. Let's look at each year one by one. We'll show you how this market has changed. Is Dubai property right for you? Let's find out.
Dubai Real Estate Market Trends
From 2014 to 2015, Dubai real estate prices stayed steady. However, from 2016 to 2019, prices went down due to more supply and a slow economy.
COVID-19 hurt prices in 2020, but they bounced back fast. High-end areas saw more demand. From 2021 to 2023, luxury properties and prime areas like Downtown Dubai saw big price jumps.
In 2025, we saw record-breaking transactions worth AED 682.6 billion across 215,060 sales, an 18.82% rise in volume and 30.64% rise in value versus 2024. This showed growing trust in the market.
In 2026, the market shifted into a cooling phase. After a strong start to the year, regional tensions from late February slowed activity. By Q3 2026, transactions were down by more than a third versus the record Q3 2025, but prices held far better than volumes, slipping only about 3% year on year.
Key Highlights
-
Property prices grew 85.7% from 2014 to 2025, with average price per square foot rising from 1,003 AED to 1,863 AED
-
Transaction volumes increased from 41,715 in 2014 to 215,060 in 2025, showing massive market expansion
-
Q3 2026: 37,292 sales worth AED 92.63 billion; off-plan took 67.4% of deals, but ready homes generated more value (AED 49.14B vs AED 43.49B)
-
Q3 2026 prices: apartments averaged ~1,794 AED/sqft and villas ~2,216 AED/sqft; prime homes still rose 3.6–4% year on year
-
2020 pandemic caused only a brief slowdown before record-breaking recovery in 2021-2023
-
Dubai Marina consistently remained the top luxury apartment location throughout the decade
-
Villa prices showed greater stability than apartments during market downturns, including the 2026 cooling (villas −1.7% YoY vs apartments −5.3% in August 2026)
-
Indian nationals maintained position as top foreign investors across the decade
Dubai Property Price Index
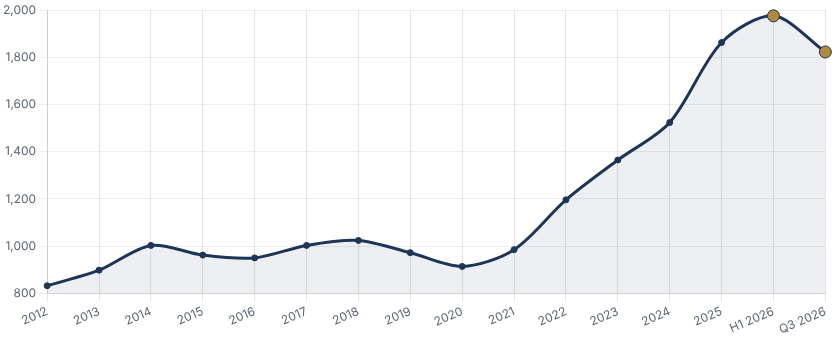
Before moving to a year-by-year analysis, let's see Dubai's property price evolution over more than a decade. Starting from 832 AED per square foot in 2012, prices rose to peak at 1,024 AED in 2018 before declining to 914 AED in 2020 during the pandemic. The most dramatic growth occurred from 2021 onwards, with prices reaching an all-time high of 1,863 AED per square foot in 2025. In 2026 prices peaked in the first half and eased to roughly 1,823 AED per square foot in Q3.
Dubai average price per sq ft, 2012 – Q3 2026
AED per sq ft
Source: DLD-based annual averages; Q3 2026 is a TLP weighted average of Q3 apartment and villa averages
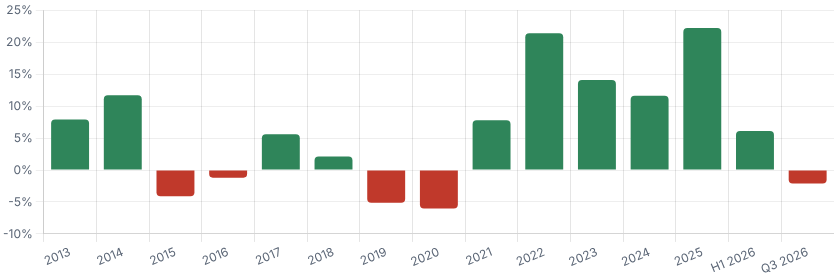
Year-over-year price change
% change in average AED per sq ft
|
Year |
Price per Sqft (AED) |
% Change from 2014 |
Year-over-Year Change |
|---|---|---|---|
|
2012 |
832 |
-17.0% |
- |
|
2013 |
898 |
-10.5% |
+7.9% |
|
2014 |
1,003 |
- |
+11.7% |
|
2015 |
962 |
-4.1% |
-4.1% |
|
2016 |
950 |
-5.3% |
-1.2% |
|
2017 |
1,003 |
0.0% |
+5.6% |
|
2018 |
1,024 |
+2.1% |
+2.1% |
|
2019 |
972 |
-3.1% |
-5.1% |
|
2020 |
914 |
-8.9% |
-6.0% |
|
2021 |
985 |
-1.8% |
+7.8% |
|
2022 |
1,196 |
+19.2% |
+21.4% |
|
2023 |
1,365 |
+36.1% |
+14.1% |
|
2024 |
1,524 |
+51.9% |
+11.6% |
|
2025 |
1,863 |
+85.7% |
+22.2% |
|
H1 2026 |
1,976 |
+97.0% |
+6.1% vs 2025 avg |
|
Q3 2026 |
~1,823* |
+81.8% |
-2.1% vs 2025 avg |
*Weighted from Q3 2026 average apartment (1,794) and villa (2,216) prices by transaction count. ValuStrat's independent index showed a similar −3.1% year-on-year move in August 2026.
Price Trend Analysis by Property Type
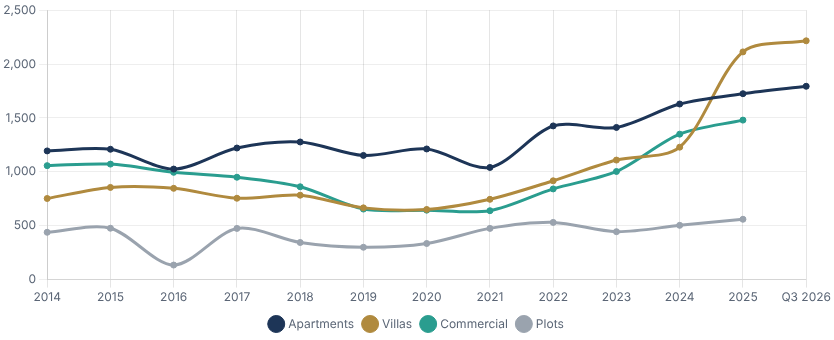
The prices in Dubai heavily vary with property type. It is important to understand the property wise price trends in Dubai. Here is the overview of this. In Q3 2026 villas remained the most expensive segment per square foot at around 2,216 AED, ahead of apartments at about 1,794 AED and townhouses at about 1,341 AED.
Price per sq ft by property type, 2014 – Q3 2026
|
Year |
Apartments (AED/sqft) |
Villas (AED/sqft) |
Commercial (AED/sqft) |
Plots (AED/sqft) |
|---|---|---|---|---|
|
2014 |
1,194.13 |
752.62 |
1,057.56 |
439.08 |
|
2015 |
1,209.51 |
855.53 |
1,071.70 |
476.73 |
|
2016 |
1,025.75 |
846.92 |
995.34 |
135.00 |
|
2017 |
1,220.99 |
754.99 |
950.01 |
475.00 |
|
2018 |
1,277.16 |
783.20 |
861.45 |
344.38 |
|
2019 |
1,152.33 |
665.62 |
654.52 |
300.00 |
|
2020 |
1,212.28 |
650.65 |
644.55 |
335.00 |
|
2021 |
1,040.80 |
745.01 |
639.34 |
475.32 |
|
2022 |
1,426.21 |
916.99 |
841.55 |
530.90 |
|
2023 |
1,412.13 |
1,109.29 |
1,003.24 |
444.57 |
|
2024 |
1,629.33 |
1,229.06 |
1,349.78 |
503.45 |
|
2025 |
1,725 |
2,113 |
1,480 |
560 |
|
Q3 2026 |
1,794 |
2,216 |
– |
– |
Off Plan vs Ready to Move Property Trend
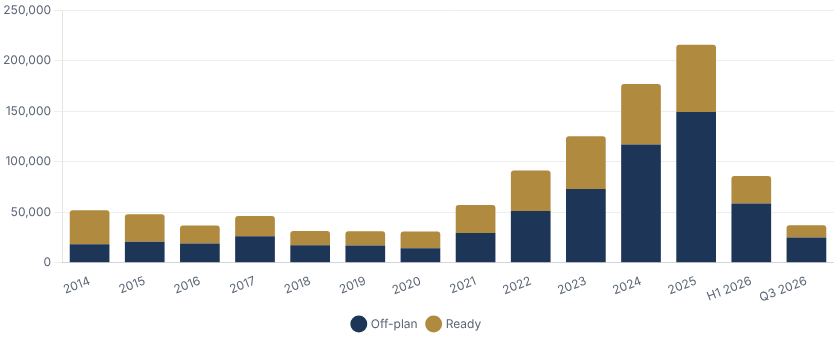
When we narrow down our analysis beyond property type, we face two types of property: off-plan and ready to move properties. Looking at data, we can see that previously the Dubai real estate market was ready-to-move focused. Over time, DLD rules and regulations, developers' flexible payment plans and government strategies have shifted the focus to off-plan projects in Dubai.
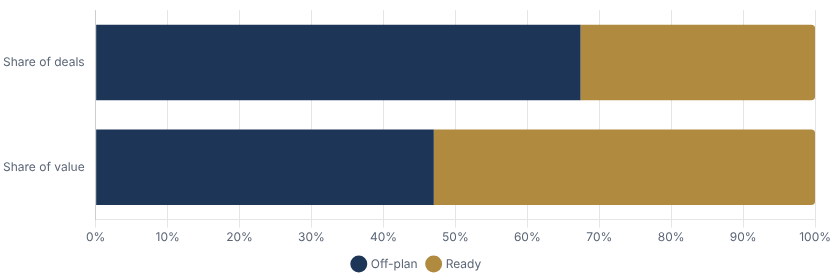
Q3 2026 added an interesting twist: off-plan still dominated by number of deals (67.4%), but ready homes generated more money (AED 49.14B vs AED 43.49B). With new launches slowing sharply, buyers leaned towards completed homes they could move into or rent out straight away.
Off-plan vs ready sales, 2014 – Q3 2026
Source: DLD figures.
|
Year |
Volume (Off-plan) |
Volume (Ready) |
Value Off-plan |
Value Ready |
AED/sqft Off-plan |
AED/sqft Ready |
|---|---|---|---|---|---|---|
|
2014 |
18,342 |
33,720 |
33B |
59B |
1,197 |
956 |
|
2015 |
20,762 |
27,440 |
41B |
51B |
1,032 |
946 |
|
2016 |
19,063 |
17,946 |
31B |
29B |
1,036 |
941 |
|
2017 |
26,381 |
19,946 |
41B |
31B |
1,091 |
963 |
|
2018 |
17,381 |
14,107 |
23B |
20B |
1,266 |
871 |
|
2019 |
17,074 |
14,107 |
25B |
20B |
1,300 |
781 |
|
2020 |
14,476 |
16,536 |
17B |
26B |
1,183 |
745 |
|
2021 |
29,527 |
27,664 |
51B |
58B |
1,175 |
876 |
|
2022 |
51,281 |
40,072 |
126B |
86B |
1,457 |
1,004 |
|
2023 |
73,095 |
52,296 |
211B |
114B |
1,550 |
1,100 |
|
2024 |
116,992 |
59,875 |
288B |
146B |
1,671 |
1,249 |
|
2025 |
149,290 |
66,446 |
448B |
239B |
1,718 |
1,481 |
|
H1 2026 |
58,842 |
27,182 |
139.75B |
146.71B |
1,780 |
1,568 |
|
Q3 2026 |
25,131 |
12,161 |
43.49B |
49.14B |
1,703* |
– |
Median off-plan apartment price in September 2026 (DXB Interact / DLD), down ~5% year on year. For the full quarter breakdown, see our Dubai Real Estate Market Report Q3 2026.
Dubai Property Prices Last 10 Years
We already see the price trends of Dubai. Let's check out what happened year by year in this market. These insights might just help decide if Dubai property deserves a spot in your investment portfolio or not.
2014 Property Price in Dubai
Dubai real estate boomed in 2014. Residential property sales kept climbing higher. Total investment hit AED 109 billion from 41,715 investors that year. Local Emiratis led spending with AED 22.7 billion. Indians topped foreign buyers, spending AED 18.1 billion across 7,353 transactions.
The market added 14,876 new units while prices averaged 956 AED per square foot. Typical apartments cost around 1,000,000 AED, with villas at roughly 3,174,944 AED.
What made 2014 special? The upcoming Expo 2020 announcement had created a buzz in this time. Investors were positioning themselves early to capitalize on expected growth.
Property Prices of Dubai Real Estate in 2015
The strong trend continued into 2015, with property sales totaling AED 267 billion – 8% more than 2014. Over 63,000 transactions happened this year. The hottest areas included:
-
Business Bay (3,212 transactions worth AED 4.95 billion)
-
Al Hebiya 4 (3,080 transactions worth AED 2.57 billion)
-
Dubai Marina (3,059 transactions worth AED 6.24 billion)
Mortgages played a crucial role in the time. Mortgage transactions totalled AED 117 billion from over 12,000 transactions. New supply dropped to just 9,069 units (39.05% less than 2014), helping keep prices stable. Square foot costs dipped slightly to 962 AED, with apartments averaging 956,746 AED and villas around 3,193,928 AED.
Meanwhile, the capital entered its own downturn, with Abu Dhabi prices falling about 4% this year (see how Abu Dhabi's market moved from 2014 to 2024).
2016 Property Price in Dubai
The market faced its first real test in 2016. Transactions fell slightly to 60,595, worth over AED 259 billion. This slowdown showed market maturity rather than serious trouble. Over 41,776 sales transactions were recorded, amounting to AED 103 billion. Land sales and mortgage transactions represented a significant portion, with a total value of AED 193 billion across 15,994 transactions.
Supply jumped back up to 15,125 units – a 66.74% increase from 2015. This extra supply pushed prices down, with square foot costs falling to 875 AED (8.47% less than 2014). Despite worldwide economic worries, developers showed faith in Dubai. They launched 134 new projects worth AED 100 billion, showing Dubai's market strength.
Foreign buyers invested nearly AED 44 billion, with Indians leading the international buyer list. Business Bay, Dubai Marina, and Burj Khalifa remained the hottest spots for property investors.
2017 Property Price Trends in Dubai
The market bounced back in 2017, reaching AED 285 billion in total transactions – up 6% in number and 4% in value compared to 2015.
-
Sales: Sales of land, buildings, and units reached AED 114 billion through 49,000 transactions.
-
Mortgages: Mortgage transactions amounted to AED 138.5 billion across 15,700 transactions.
-
Other Transactions: Approximately 4,000 other transactions were valued at AED 33.3 billion.
Supply grew steadily to 15,633 units. Square foot prices recovered slightly to 1000 AED, up 5.16% from 2016. Apartment prices rose to 963,170 AED while villa prices held steady around 2,685,888 AED.
Dubai's global appeal grew stronger, attracting 39,480 investors who together spent over AED 107 billion. UAE nationals led with AED 25.3 billion, followed by Indian buyers with AED 15.6 billion.
Burj Khalifa (2,008 transactions worth AED 7.368 billion), Business Bay (3,763 transactions worth AED 7.115 billion), and Dubai Marina (3,300 transactions worth nearly AED 7 billion) remained the best areas to invest in Dubai.
Dubai Property Prices in 2018
The market shifted toward quality in 2018. Dubai residential market saw over 5,454 villas and 25,595 apartments transacted. Ready property sales dropped to AED 74.7 billion (10% less than 2017), showing buyers became more selective. Square foot prices rose to 940 AED, up 4.44% from last year. Yet average apartment prices fell to 873,000 AED, and villa prices dropped to 2,400,000 AED.
Off-plan sales dropped sharply by 34% to AED 23 billion. Jumeirah emerged as a bright spot, becoming the best area for off-plan sales. Developments in World Islands, City Walk, Port de la Mer, Jumeirah Bay, and Madinat Jumeirah contributed to this success.
Luxury property sales totaled AED 39 billion, led by Business Bay (AED 6.9 billion), MBR City (AED 6.3 billion), and Downtown Dubai (AED 5.4 billion).
Property Prices in Dubai 2019
As Expo 2020 drew closer, property interest picked up. Sales transactions topped 41,998, worth AED 226 billion – notably higher than 2018's AED 223 billion. This year, the Dubai government introduced the Golden Visa programme, which is a long-term residency visa that allows foreigners to live, work, and study in the UAE without a national sponsor. This step has further boosted the property market.
Dubai saw a dramatic rise to 28,777 units, up 79.87% from 2018. This flood of new properties pushed prices down, with square foot costs falling to 853 AED (9.26% less than 2018).
Dubai Marina strengthened its position as the top spot for apartment buyers, with 3,369 transactions worth AED 8.07 billion – way up from 2,526 transactions in 2018.
The market seemed to be picking up steam, and then 2020 arrived…
2020 Dubai Property Price Trends
By 2020, the pandemic hit global markets hard, including Dubai. Yet the property sector adapted quickly with virtual sales tools. Supply still grew slightly to 30,353 units despite worldwide uncertainty. Square foot prices kept falling to 914 AED, down 6% from 2019. Most areas saw modest price drops under 10%.
Villas held their value better than apartments. Dubailand stayed the favorite for affordable villas in Dubai, with prices dropping just 2.4%. The Springs saw only a tiny 1.9% decrease.
People started wanting bigger homes as lockdowns made space more valuable. These changing needs set up the coming market surge. The same shift towards villas and land showed up in the northern emirates too; Ras Al Khaimah's property market recovered strongly in the second half of 2020.
Dubai Property Price in 2021
After the pandemic, Dubai's property market started recovering. The 2021 year saw over 84,196 transactions worth nearly AED 300 billion – setting a new record in Dubai's real estate history.
-
Off-Plan vs. Secondary Market: 59.6% of transactions were for secondary/ready properties, while 40.4% were for off-plan properties.
The supply cycle grew to 31,964 units, up 5.31% from 2020. Despite more properties available, square foot prices dipped slightly to 794 AED, hitting the decade's lowest point. This represented a 66.3% jump in transaction numbers and 72% more value than 2020. Property sales hit AED 151.07 billion, breaking a 12-year record.
Ready property sales reached their highest level since 2008, while off-plan sales surged, especially in late 2021.
2022 Property Prices in Dubai
Continuing the previous year's trend, Dubai's real estate market experienced exponential growth in 2022, with property prices for both villas and apartments increasing significantly. According to the Dubai Land Department, there were 97,466 sales transactions worth AED 265.6 billion, marking a record-breaking year for the sector. Both villa and apartment prices climbed significantly.
Square foot prices jumped dramatically to 1,039 AED – an amazing 30.86% property appreciation rate in Dubai that too just in a single year. Apartment prices rose to 1,198,000 AED, while villa prices edged down slightly to 2,050,000 AED.
Jumeirah Village Circle (JVC) remained the top choice for affordable apartments, with a 7.25% increase in average price-per-square-foot, reaching AED 896. Dubai Marina saw apartment prices climb 11.6% to AED 1,501 per square foot. DAMAC Hills 2 became the top choice for affordable villas in Dubai, with prices up 2.89% to AED 626 per square foot. Dubai Hills Estate and Arabian Ranches 3 were top choices for luxury villa buyers. Dubai Hills Estate recorded a sales volume of 2,536 transactions worth AED 12.5 billion.
2023 Property Prices in Dubai
Dubai's property market hit all-time highs with 132,628 sales valued at AED 409.8 billion. Prices rose across luxury, mid-range, and affordable segments.
The affordable apartment segment saw a notable increase in property prices, with areas like International City leading the way. The price-per-square-foot for apartments in International City surged by 15.5%, averaging AED 583. The average transaction price in the area stood at AED 383.2k, following a 5.22% Dubai property appreciation. As Dubai's entry prices climbed, many value-focused families also started comparing options next door; our guide to Sharjah property prices shows how much further the same budget can go.
In the mid-tier segment, Jumeirah Village Circle (JVC) emerged as the most sought-after district. The price-per-square-foot for flats in JVC recorded a 7% uptick, averaging AED 1,016. The average transaction price in the area was AED 691.7k, marking a 2.75% increase.
Dubai Marina retained its position as the preferred destination for luxury apartments in Dubai. The price per square foot for apartments in Dubai Marina increased by 9.16%, averaging AED 1,737. The average transaction value surged by 16.6%, reaching AED 1.88M, while DAMAC Hills 2 stayed the top pick for budget-friendly villas, with prices up 10.7% to AED 743 per square foot.
Dubai Property Price in 2024
Following 2023's record year, 2024 saw more growth despite global money troubles. According to the Dubai Land Department (DLD), there were over 169,000 property sale transactions recorded in 2024, valued at AED 488 billion. The ready segment accounted for over 67,000 transactions, exceeding AED 274 billion, while the off-plan segment achieved over 102,000 transactions worth AED 213 billion.
Square foot prices reached 1,386 AED – up 17.96% from 2023 and a whopping 44.98% higher than 2014. Apartment prices grew to 1,280,000 AED, while villa prices soared to 3,535,544 AED, almost matching their 2014 peak.
Jumeirah Village Circle led the mid-range apartment market with prices up 12%. Dubai Marina stayed on top for luxury apartments with 7% growth. DAMAC Hills 2 saw villa prices jump 6-17%.
The Valley by Emaar showed the biggest price increase in affordable villas, while Arabian Ranches topped the luxury villas in Dubai with substantial growth.
2024 was a record year across the UAE: Abu Dhabi crossed AED 96 billion in transactions, Sharjah hit an all-time high of AED 40 billion and Ras Al Khaimah's sales jumped nearly 85%. See the UAE comparison below.
Dubai Real Estate Market in 2025
2025 confirmed Dubai's property market at its strongest ever. Dubai recorded 215,060 real estate transactions with a combined value of AED 682.5 billion, an 18.82% rise in transaction volume and a 30.64% increase in value versus 2024. Off-plan transactions dominated the market, accounting for a record 65% share of all sales, totalling approximately 149,290 transactions worth AED 448 billion.
Home loans kept expanding, with 25-year payment plans becoming common, making buying property possible for more people. Average price per square foot closed the full year at 1,863 AED — a 22.2% rise over 2024.
Dubai Real Estate in H1 2026
H1 2026 opened with impressive momentum. January alone saw AED 72.33B in real estate transactions. Off-plan sales continued to dominate, with buyers from Russia, Europe, and India leading demand. Average price per square foot reached approximately 1,976 AED in H1 2026, the highest level on record.
Dubai's market remained strong even through Ramadan 2026, recording 15,196 transactions during the period. Business Bay, Downtown Dubai, and Palm Jumeirah remained the headline performers for both apartments and villas heading into Q2 2026. From late February, however, regional tensions began to weigh on buyer confidence, and price growth started to cool through Q2.
Dubai Real Estate in Q3 2026
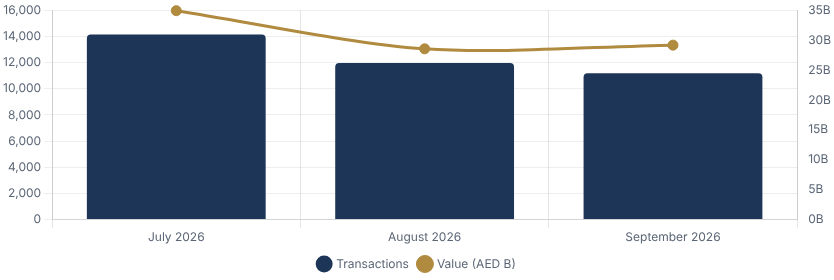
Q3 2026 was the quarter where Dubai's market clearly changed gear. The Dubai Land Department recorded 37,292 sales transactions worth AED 92.63 billion: July was the busiest month (14,141 deals, AED 34.92B), followed by August (11,965 deals, AED 28.54B) and September (11,186 deals, AED 29.16B). Compared with the exceptional Q3 2025, deal numbers were down by more than a third and total value was close to half.
Q3 2026 monthly sales
Transactions (bars) and sales value in AED billion (line)
Source: DLD via TopLuxuryProperty Q3 2026 market report.
What drove the slowdown? Developers pulled back on launches (Savills counted only around 5,000 new units launched in Q3 versus about 36,400 in Q2), and off-plan buyers became more cautious after the regional conflict that began in late February. Ready homes took a bigger slice of the market and actually out-earned off-plan by value.
Q3 2026: off-plan vs ready
Share of deals vs share of value
Prices, however, held up far better than volumes:
-
Citywide: the median residential price was 1,700 AED/sqft. ValuStrat's price index stood at 218.8 points in August, down 3.1% year on year and about 10% below February, with monthly declines now close to zero.
-
By type: villas averaged about 2,216 AED/sqft, apartments about 1,794 AED/sqft and townhouses about 1,341 AED/sqft.
-
Prime: Savills put prime apartments at 5,237 AED/sqft (+4% YoY) and prime villas at 2,791 AED/sqft (+3.6% YoY). 669 homes sold above AED 10 million, including a AED 260 million villa on Palm Jumeirah.
-
Rentals: 242,500 residential leases were registered in Q3 with a median annual rent of AED 73,000. Gross yields averaged close to 7% for apartments and 5% for villas in H1 2026.
-
Nine months: sales from January to September reached about AED 379 billion, still the second-highest nine-month total in Dubai's history after 2025.
By area, Dubai South (Madinat Al Mataar) led with 4,849 deals worth AED 6.18 billion, followed by JVC and City of Arabia. Business Bay and Palm Jumeirah generated outsized value from far fewer transactions.
Dubai Property Prices Last 20 Years
|
Period |
Phase |
What happened |
Main drivers |
|
2003–2008 |
Boom |
Freehold law opened the market to foreigners; Palm Jumeirah and Dubai Marina launched. Villa prices rose 200–300%. |
Freehold ownership, foreign inflows, mega-projects |
|
2008–2009 |
Crash |
Some communities lost 50–60% of value within 18 months. |
Global credit crunch, oversupply |
|
2010–2014 |
Recovery |
Villas recovered first; apartments rose about 35%. The 2013 Expo win lifted sentiment. |
Infrastructure, Expo 2020, institutional investors |
|
2015–2019 |
Correction |
Apartments fell 15–20% and villas 10–12%. Affordable housing gained ground. |
Oil slump, oversupply, tighter rules |
|
2020 |
COVID low |
Average price fell to AED 914 per sq ft, the decade's low. |
Lockdowns, job losses |
|
2021–2024 |
Rally |
Prices rose 67% from the 2020 low. Prime villas in Palm Jumeirah and District One set records. |
Golden Visa, HNWI inflows, remote work |
|
2025 |
Peak |
AED 1,863 per sq ft; AED 682.5 billion in sales across 215,060 deals. |
Russian, European and Indian buyers; off-plan |
|
2026 |
Correction and plateau |
Prices fell about 10% after the February conflict, then flattened. Prime still rose 3.6–4% YoY. |
Geopolitics, record handovers, selective buyers |
Dubai Property Appreciation Rate
|
Year |
Avg. Price per sq. ft. (AED) |
Annual Growth % |
Market Observations |
Segment Highlights |
|---|---|---|---|---|
|
2021 |
985 |
+7.8% |
Recovery begins after the 2020 low and a prolonged correction. |
Villas in communities like Emirates Hills and Palm Jumeirah were priced at historic lows, presenting buying opportunities. |
|
2022 |
1,196 |
+21.4% |
Strong rebound with foreign buyers leading demand. |
Luxury villas rose faster (+30%) vs. apartments (+18%). |
|
2023 |
1,365 |
+14.1% |
Demand shifted towards waterfront communities (Palm, Dubai Hills, Jumeirah Bay). |
Ultra-luxury homes above AED 50M recorded record transactions. |
|
2024 |
1,524 |
+11.6% |
Dubai became one of the top 5 fastest-growing property markets globally. |
Villas saw double-digit growth in areas like Jumeirah Islands (+41%) and Palm Jumeirah (+40%). |
|
2025 |
1,863 |
+22.2% |
215,060 transactions worth AED 682.5 billion. Off-plan hit 65% market share. |
Villas in Palm Jumeirah and Bluewaters led; JVC and Business Bay apartments outperformed. |
|
H1 2026 |
1,976 |
+6.1% vs 2025 avg |
January 2026 alone hit AED 72.33B. |
Off-plan continues to dominate; Downtown Dubai, Business Bay and Palm Jumeirah lead all segments. |
|
Q3 2026 |
~1,823 |
-2.1% vs 2025 avg |
37,292 sales worth AED 92.63B; ValuStrat index −3.1% YoY (Aug). |
Prime apartments +4% and prime villas +3.6% YoY; villas (−1.7%) more resilient than apartments (−5.3%) in the broad index. |
How Dubai Compares With Abu Dhabi, Sharjah and Ras Al Khaimah
Dubai is by far the UAE's largest property market, but in 2026 it is no longer the only one setting records. Here is how the four main emirates compare on current prices and total transactions so far this year, using the latest official and research data available in October 2026.
-
AED 574.1B Dubai · Jan–Sep 2026 · 165,018 transactions
-
AED 175.7B Abu Dhabi · Jan–Sep 2026 · H1 value +112% YoY
-
AED 46.8B Sharjah · Jan–Sep 2026 · 91,560 deals, +14% YoY
-
AED 2.89B Ras Al Khaimah · H1 2026 · 2,085 transactions
Dubai still dominates on scale. Its AED 574 billion in transactions over the first nine months is more than three times Abu Dhabi's and over twelve times Sharjah's. The difference is momentum: Dubai's volumes are cooling, while Abu Dhabi more than doubled its transaction value in H1 2026 (+112%) on the back of large off-plan launches on Hudayriyat, Saadiyat and Yas islands, and foreign direct investment that jumped 309%. Sharjah grew steadily, with deal numbers up 14% and value up 5.6%. Ras Al Khaimah remains a much smaller market, recording AED 2.89 billion in the first half.
Total real estate transaction value by emirate, 2026 year to date
AED billion, all transaction types (sales, mortgages and other) · logarithmic scale so the smaller emirates stay visible
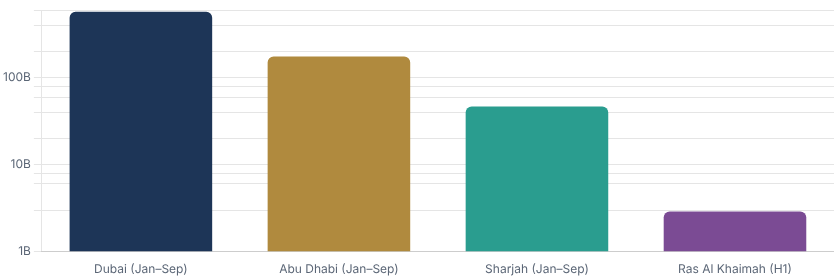
Dubai, Abu Dhabi and Sharjah: January–September 2026. Ras Al Khaimah: January–June 2026 (latest official figure). Sources: DLD, ADREC, Sharjah Real Estate Registration Department, RAK Municipality Lands & Properties Sector.
Current Property Prices in 2026
The price picture is more surprising. Abu Dhabi's median transaction price reached about 1,798 AED per sq ft in Q3 2026, up 18.3% year on year and now slightly above Dubai's residential median of 1,700 AED. That is driven by the mix of new waterfront villa and townhouse launches being sold in the capital. Dubai prices are roughly 3% lower than a year ago. Sharjah remains the value option at around 970–1,010 AED per sq ft, while Ras Al Khaimah prices vary widely, from about 1,160 AED per sq ft for Al Marjan Island apartments to around 2,300 AED for new branded beachfront stock.
Price per sq ft by emirate, 2026
AED per sq ft · latest available quarter for each emirate
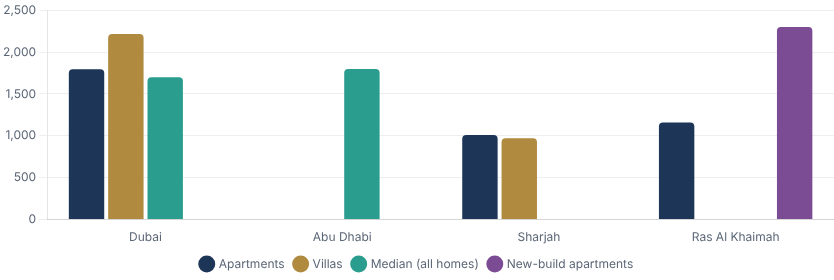
Dubai Q3 2026 (DLD / Al Masdar Al Akari); Abu Dhabi Q3 2026 median, all property types (ADX Interact / ADREC); Sharjah Q2 2026 asking prices (Savills); Ras Al Khaimah: Al Marjan Island apartments Q2 2026 (ValuStrat) and new-build apartments H1 2026 (CBRE). Figures use different methods, so treat them as a guide.
Year-on-year price change by emirate, 2026
% change · latest available reading
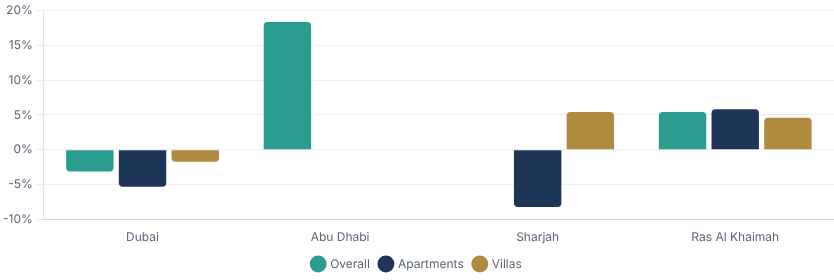
Dubai: ValuStrat index, Aug 2026. Abu Dhabi: median AED/sqft, Q3 2026 (ADX Interact). Sharjah: Savills asking prices, Q2 2026. Ras Al Khaimah: ValuStrat, Q2 2026.
|
Emirate |
Total Transactions 2026 YTD |
Sales 2026 YTD |
Price per Sq Ft (2026) |
Price Change YoY |
Market Mood |
Full 10-Year Guide |
|---|---|---|---|---|---|---|
|
Dubai |
AED 574.1B · 165,018 deals (Jan–Sep) |
≈AED 379B (Jan–Sep); Q3: 37,292 sales, AED 92.6B |
Median 1,700 · Apts 1,794 · Villas 2,216 |
−3.1% (apts −5.3%, villas −1.7%) |
Cooling after record 2025; volumes down, prices resilient |
You are here |
|
Abu Dhabi |
AED 175.7B (Jan–Sep) |
Residential: 21,416 sales, AED 95.8B (Jan–Sep) |
Median 1,798 (all types, Q3) |
+18.3% |
Strongest growth in the UAE; off-plan villa launches lead |
|
|
Sharjah |
AED 46.8B · 91,560 deals (Jan–Sep) |
24,749 sales, AED 35B (Jan–Sep) |
Apts ~1,010 · Villas ~970 (asking, Q2) |
Apts −8.2% · Villas +5.4% |
Steady volume growth; apartment prices easing |
|
|
Ras Al Khaimah |
AED 2.89B · 2,085 deals (H1) |
1,274 sales, AED 1.35B (H1) |
Al Marjan apts ~1,160 · new-build apts ~2,298 |
+5.4% overall (apts +5.8%, villas +4.6%) |
Small but rising; Wynn resort (2027) driving demand |
Future Project Supply Projection
Based on the property data from past performance and projections, we can observe the trends for future planned property supply starting from 1st of January 2025. The following table outlines the expected units over the next several years, alongside the latest 2026 estimates of what will actually be delivered.
Dubai residential supply: planned vs latest delivery estimate
Units
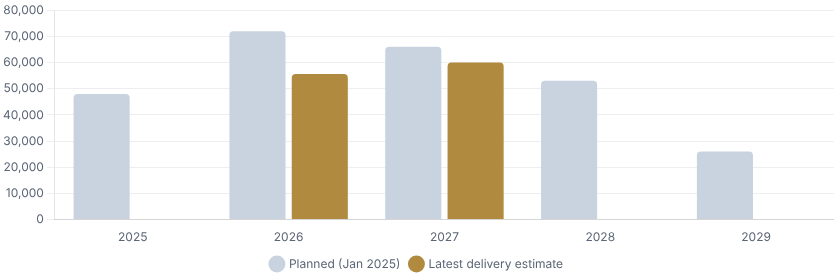
Planned: projection as of Jan 2025. Latest estimate: Cushman & Wakefield Core, H1 2026 report.
|
Year |
Planned Property Supply (Jan 2025) |
Latest Delivery Estimate (2026) |
|---|---|---|
|
2025 |
48,000 |
– |
|
2026 |
72,000 |
~55,600 (highest since 2008) |
|
2027 |
66,000 |
60,000+ |
|
2028 |
53,000 |
– |
|
2029 |
26,000 |
– |
Planned figures usually overstate real handovers; projects slip as construction progresses. Launches also slowed sharply in 2026, which should ease supply from 2028 onwards.
What Does This Mean For You?
Dubai's property market over ten years tells quite a story. From steady growth through pandemic troubles and back to record sales, and now a measured cooling in 2026, its resilience stands out.
Keep these points in mind when thinking about investing:
-
Dubai property has proven tough through market cycles
-
Luxury spots like Dubai Marina and Palm Jumeirah keep attracting buyers, and prime prices kept rising even in Q3 2026
-
Villas tend to hold value better when markets dip, as the 2020 and 2026 data both show
-
The market looks more mature now, suggesting steadier future growth rather than another 20%+ year
-
Record handovers (around 55,600 homes in 2026 and 60,000+ in 2027) give buyers more choice and more negotiating power, especially in apartment-heavy communities
-
Gross rental yields of around 7% for apartments remain well above most global cities
Looking at 2014-2025 data, Dubai property has beaten many global markets. Yearly price increases ranged from 3% to 10% in normal years, with luxury homes seeing the best growth at roughly 10% yearly.
For those eyeing Dubai real estate, the 2026 slowdown has created better entry prices in some established areas, while the long-term fundamentals remain in place. If Dubai is above your budget, compare it with Sharjah or Ras Al Khaimah; if you prefer a steadier, government-led market, look at Abu Dhabi.
How do you feel about Dubai's property market? Thinking about buying, or already own something there? Contact us at +971 58 512 3244.